By Rowland Davis and James Buchen
July 21, 2020

This is Part One of our blog series on “Big Oil” discussing important background issues related to oil supply, demand, and price. In Part Two, we will explore the different business strategies major oil companies are currently pursuing. Other future blog posts will explore additional issues related to the oil business. Let’s begin…
Supply
Discussions of oil supply start with two questions. First, how much oil is being produced and sold? Second, is there adequate oil inventory for future sales? Our focus is on the longer-term, as the world transitions to a low-carbon economy. Using this longer-term timescale, the two previous questions can be answered simply:
1. How much oil is being produced and sold?
The simple answer here is “whatever amount is required to meet global energy demand.” The supply question ultimately turns into a demand issue. In basic terms, global energy demand will tend to grow as the population and the economy grow, offset by efficiency gains. The portion of global energy demand fulfilled by fossil fuels will depend on how far green energy solutions have advanced. Until the day when all global energy is 100% green energy, fossil fuels will continue to fill the gap, using the most cost-efficient blend of oil, gas, and coal resources available, based on regional conditions. Before the COVID-19 slowdown, global oil production was at about 100 million barrels per day.
2. Is there adequate oil inventory for future sales?
Sadly, yes, there is plenty of oil inventory, sufficient enough to toast everything on earth. Proven oil reserves could maintain 50 more years of production at 100 million barrels per day, but the goal of climate safety through a “carbon budget” (i.e. keeping the Earth below 2 degrees Celsius of warming) does not allow for that much future production.
Excess oil supply becomes a key strategic concern for oil owners when demand, and prices, start to fall. In that situation, oil owners need to find ways to avoid being stranded with unsold assets (i.e. leaving unsold oil in the ground, meaning no oil can be sold to cover their initial investment).
Let us consider the players in the oil business. When many people think of “Big Oil”, they often think of the so-called super majors which consist of seven huge companies that operate globally and whose businesses include exploration and production (“upstream”), transportation and storage (“midstream”), and refining and distribution (“downstream”). They are also referred to as the ‘integrated oil companies’, or IOCs. The US-based IOCs are ExxonMobil, Chevron, and ConocoPhillips. The European-based IOCs are Royal Dutch Shell, British Petroleum, Total, and Eni. Big as they are, together they only account for just over 10% of global oil production. Many of these companies also have substantial natural gas operations. The next 15+ mid-sized investor-owned companies account for another 6% to 7% of global oil production. Then there are thousands of much smaller operators, often privately held and predominately in the United States. Statistics on these small private operators are harder to come by, but they probably account for between 5% to 10% of global oil production.
The biggest players by far are actually the Nationally Owned Companies (NOCs), like Saudi Aramco. Altogether there are more than 70 NOCs around the world. In aggregate, their oil production accounts for somewhere between 75% to 80% of global production. Perhaps even more important, these NOCs control about 90% of proven oil reserves. The operation of the NOCs is controlled by their governments. Some of these governments have formed organizations like OPEC through which they can attempt to coordinate production and thus control/support oil prices. So, the investor-owned oil majors are trying to execute their business plans in a world where government-run operations control most resources. Currently, there is a significant amount of co-operation between the NOCs and the IOCs, with most major oil projects established through joint venture arrangements. Arguably, with a world of falling demand and lower prices, this co-operative system might become a competition that ends in the last player standing. The strange events at the end of April provide us a flavor of what that new competitive world might feel like.
Once oil is extracted and processed, it becomes a mostly fungible commodity with a well-developed global delivery infrastructure. Gas is somewhat less transportable, but with LNG and international pipelines, it is also a globally traded commodity. There are about 1,500 major oil fields, plus more than 60,000 smaller ones, and about 2 million operating oil wells. Although one barrel of any specific refined oil product is pretty much identical with any other barrel of the same refined oil product, that is not the case with oil that is still in the ground. The difficulty and cost of extraction can differ substantially depending on the oil field. Oil may be refined differently based on demand and the nature of the raw product. Oil companies need to make large upfront capital expenditures to develop an oilfield project so the long-term profitability of a project is obviously a primary consideration for them. Costs that affect long-term profitability are a combination of those upfront capital expenditures, cost of extraction, operation/refining costs, and the expected lifetime of the project. These and other oil company business decisions could change dramatically as we shift away from a world of consistently growing oil demand to a new world with shrinking oil demand.
Below is an important chart that highlights the range of different oil field types. The left axis shows the cost of production (i.e. average and range represented by the level and length of each bar), and the bottom axis shows the size of global reserves (i.e. represented by the width of each bar). It is important to note a couple of items:
-
- On the left side are major Middle East NOCs which sit on vast reserves of high-quality oil and can produce it at a lower cost than anywhere else in the world. Of importance, however, these countries are petrostates without diversified economies – so they rely heavily on their oil resources. For example, although Saudi Arabi can produce oil at an average of $27 per barrel, they require a significantly higher price to run their country as desired. Some have said their target price may be near $85 per barrel.
- On the right side of the chart, we see the higher cost shale oil fields in the U.S., oil-sands in Canada, and Arctic-based projects.
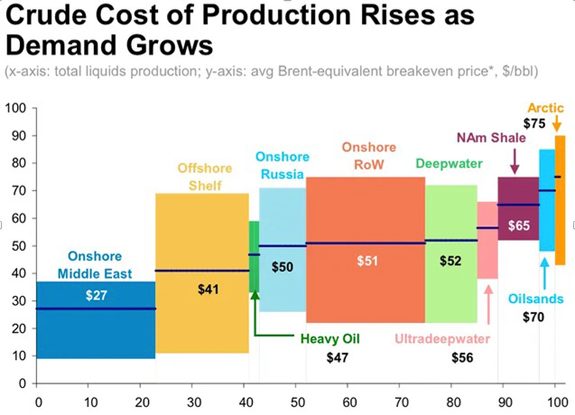
So this illustrates that, if supply is controlled by demand, falling oil demand will have major repercussions on where the oil comes from and who will be producing it.
Demand and Price: Pre-COVID-19 World
The demand for oil will dictate how the oil industry continues to be structured. In a future with falling demand, who will be the winners and who will be the losers?
To understand demand, we need to first understand the different uses for oil. The chart below shows the breakdown of oil use for the member nations in the OECD (the Organization for Economic Co-operation and Development, an intergovernmental economic organization consisting of 37 countries).
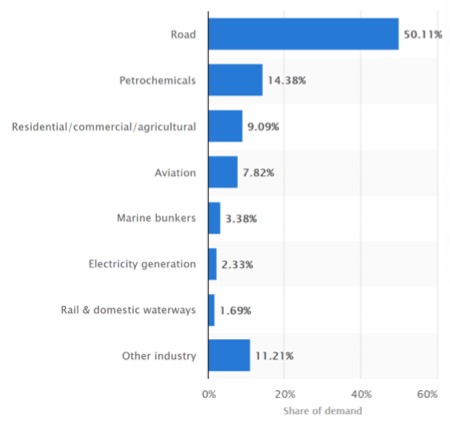
The majority of oil (63% of the total) is used by the transportation sector, mostly for light-duty vehicles and for trucking (50%) with the balance of transportation uses split among aviation (8%) and rail and marine (5%). The petrochemical sector is the next largest oil user with 15%. A small portion is used for electric power. It follows, therefore, that to reduce oil demand the most, the transportation sector must be targeted. Thankfully, the electric vehicle (EV) market is expected to grow rapidly in the years ahead, leading to the replacement of internal combustion engine (ICE) vehicles. When those battery-powered electric vehicles (BEVs) become rechargeable using 100% renewable electric power (e.g. solar, wind) and fuel cell powered vehicles (FCEVs) become rechargeable using green hydrogen, the remaining demand for oil would be significantly reduced. Aviation and marine are tougher to decarbonize. The shipping industry may be able to turn to hydrogen storage as a fuel, and aviation may be able to turn to bio-jet fuels, but for the moment, there is not a clear technology to decarbonize these two industries.
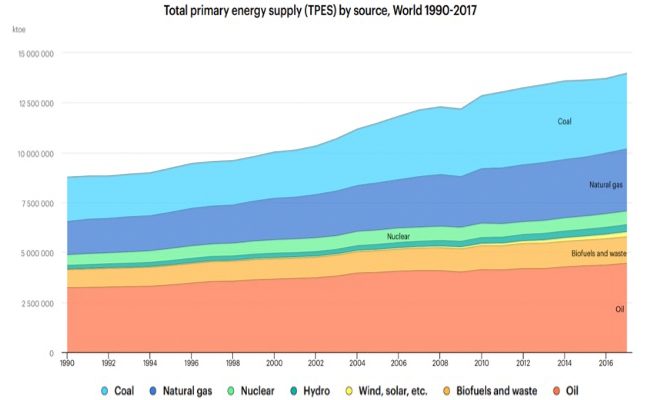
This chart shows the history of global energy supply by source, from 1990 to 2017. Total demand is growing, and fossil fuels have clearly been dominant. The portion from oil has been the single largest source over this entire period, beginning at about 37% in 1990 and then gradually declining to about 31% in 2017.
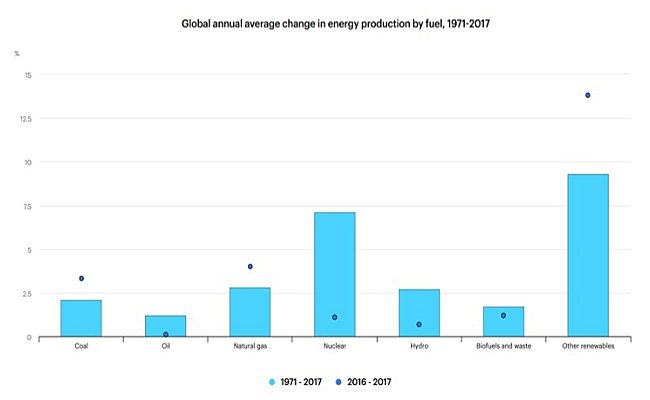
But degree of change in the various energy sources is better indicated in this next chart. Each bar represents the average growth rate for each energy source over the last forty years, and the dots show the more recent rate of change between 2016 and 2017. For oil, the average long-term growth rate has been around 1.3% per year, but that growth has fallen closer to 0% in recent years. You can also see the high, and accelerating, growth rate of renewable energy.
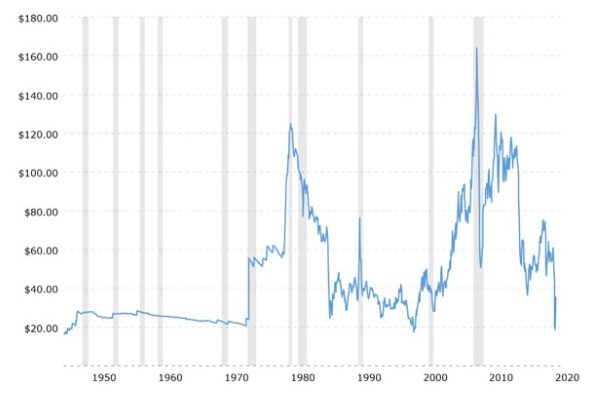
Finally, this chart shows the historical prices for a barrel of oil. General observations are:
-
- Volatility, over the entire period.
- The “oil shocks” in the 70’s and at the same time the OPEC cartel began in 1973.
- A prolonged period of prices in the $30 -$50 range from about 1985 to about 2000.
- Sharp upward price moves from 2000 to 2014 fueled largely by growing demand in developing economies and other factors, which triggered expansion of production to more costly areas like shale oil.
- A very sharp drop in 2014-2015, caused mostly by the new U.S. supply from fracked shale oil fields.
- Prices mostly in the range of $40 to $70 in the last five years.
- The sudden drop in 2020 to a low of about $20 (due to COVID-19 and temporary OPEC+ breakdown), with prices now recovering but not to pre-COVID-19 levels.
What Next?
“Prediction,” goes an old Danish proverb, “is hazardous, especially about the future.” But predict we must. Ultimately, future oil demand will peak at some point and then start to shrink. The big questions are:
-
- When will peak fossil fuel demand occur?
- How fast will the decline be after the peak is reached?
- What will the reduced demand mean for prices?
- How will these play out within the coal, oil, and gas sectors?
The answers to these questions will differ depending on who you ask – but they become an important key to our climate future.
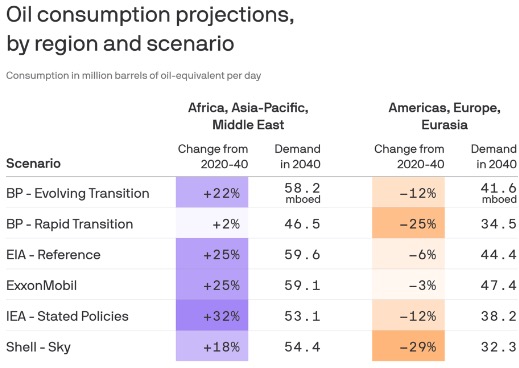
Let us start with peak demand as viewed by fossil fuel industry insiders. The following chart is from a detailed new report by the research group Resources for the Future. The chart shows results from forecasts performed in 2018 (i.e. before the COVID-19 slowdown). The bars on the right show the projected 2040 levels of global energy consumption (demand) by fuel source under several different forecasts that are in some way connected to the energy industry. This presents a generally a depressing picture for climate activists. Three of these forecasts are from the International Energy Association (IEA), using different assumptions about how rapid the transition to a low carbon economy occurs. For this discussion, we will focus on two of the IEA scenarios which bracket the other forecasts well. The remaining forecasts in this chart are from major oil producers (OPEC, BP, Shell, ExxonMobil, Equinor) and other industry associations (EIA in the US and IEEJ in Japan). Note that this energy demand excludes non-energy-related demand (e.g. oil used for petrochemicals).
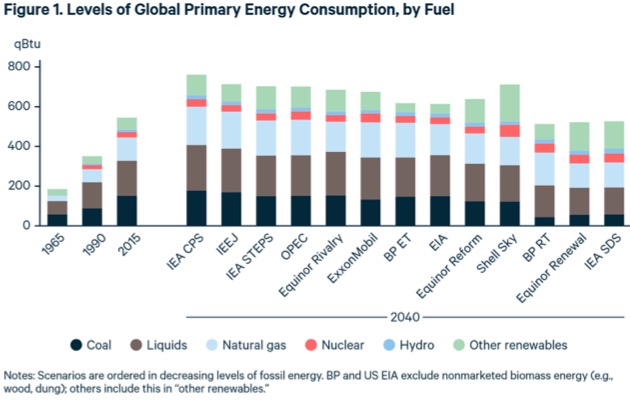
All of these forecasts include similar assumptions about global population growth (just under 1% per year for the IEA) and economic growth (about 2.4% growth in per capita GDP for the IEA), with total GDP growth of about 3.4% per year. From this base, the projections for total energy demand in 2040 will depend on the scenario assumptions. Here are the two IEA scenarios:
1. IEA STEPS (“Stated Policies”)
-
-
- Assumes currently announced policies/targets as of 2018 are implemented.
- Total energy demand grows 1.0% per year, with fossil fuels moving from 82% of the total down to 75% of the total.
- Oil demand grows 0.5% per year.
- Renewables grow 2.9% per year.
-
2. IEA SDS (“Sustainable Development”)
-
-
- Assumes policies adopted as required to limit warming to 1.7⁰C – 1.8⁰C (with substantial reliance on carbon capture technology in the latter part of the century).
- Total energy demand shrinks 0.3% per year, with fossil fuels moving from 82% of the total down to 60% of the total.
- Oil demand shrinks 1.3% per year.
- Renewables grow 3.7% per year.
-
Now let us look at another organization’s perspective, the Carbon Tracker Initiative (CTI). In their work from last year, CTI showed that peak fossil fuel demand could occur sometime within the next seven years, based on this chart and the assumptions they make:
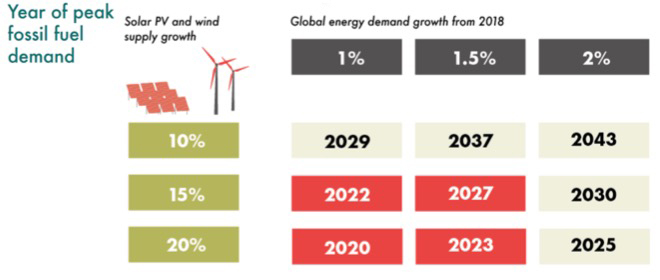
With the crash in demand caused by COVID-19, Kingsmill Bond from CTI presents a scenario that the peak fossil fuel year may actually be behind us (2019). Driving this perspective is the assumption of continued rapid growth of the renewable energy sector. Peak oil will be sometime later, depending primarily on the speed of transition from ICE’s to BEV’s and FCEV’s.
So who should we believe? Can we be comfortable with the CTI analysis? The CTI experts have some observations in support of a more rapid energy transition. Here are a few of the key ones:
-
- Governments and policymakers see the need for immediate decarbonization efforts and will not wait for unproven carbon capture technologies. Post-COVID-19 stimulus programs are likely to accelerate these decarbonization efforts.
- While the industry and IEA projections tend to assume gradual changes, there are critical tipping points in the technologies and market costs that will trigger rapid change.
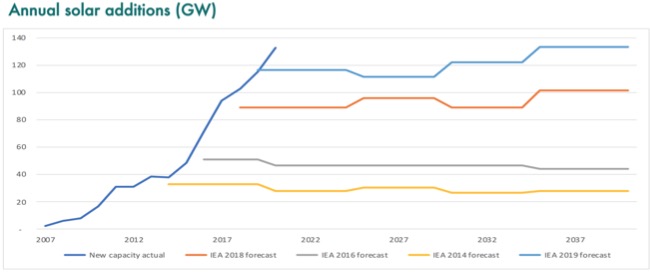
- The IEA forecasts have consistently underestimated the growth rate for renewables, as shown in this graph:
-
- Continued rapid growth in renewables could eliminate fossil fuels in the global electric power generation sector by 2050, with a 2030 tipping point where renewables exceed fossil fuels.
- Developing economies like China and India are likely to “leapfrog” into new green technologies much more rapidly when they are cost-efficient (e.g. rapid adoption of cell phones without going through any “land line” infrastructure needs). However, the industry forecasts tend to assume that falling demand in developed economies will be offset by growing demand in developing economies, as seen in this chart:
-
- Combined with the developing world’s likely tendency to “leapfrog” directly to EV’s to meet growing vehicle demand, plus a major emphasis on EV investments from Europe and China (and perhaps the US with a change in party control) as part of their COVID-19 recovery efforts, the speed of the EV transition could be rapid.
Putting all of this information together, we can see a very different picture of demand compared with the industry forecasts, as shown by this chart of expected demand by fuel source (produced by a consortium of climate experts as part of the “Inevitable Policy Response” initiative). Oil demand in 2040 is 30% lower than in 2020, compared with +10% in the IEA STEPS projections and -24% in the IEA SDS projections. Renewable demand is 200% higher in 2040 than in 2020, compared with +77% in the IEA STEPS projections and +106% in the IEA SDS projections.
Price Implications and Business Strategies
These different demand forecasts (i.e. industry insiders vs rapid decarbonization advocates) lead to different expectations for what the equilibrium price for oil will be. History has shown that oil prices are sensitive to small changes in demand. Much of the industry seems to assume oil prices returning to pre-COVID-19 levels with a floor price trading level of around $50, and with expected prices generally above this level. Of course, COVID-19 has had an unprecedented effect on the world, and this price could change. This may happen if demand fully recovers and then follows the growth pattern assumed in the energy industry forecast scenarios. However, the lower demand in the rapid transition scenarios are likely to create prices at least 20% lower in the next five to ten years. (Two of the European majors — BP and Shell — recently lowered their long-term price assumptions and took major asset write-downs.) We repeat this chart to indicate why all of this matters for oil companies that are trying to plot a course for their business strategies:
Once prices start to fall below $50 per barrel, the profitability of the industry, as currently constructed, will quite possibly decline precipitously. In the next part of this “Big Oil” series, we will explore how the oil industry responds to changes in demand and price. Stay tuned.


