By Rowland Davis
June 20, 2020
A couple of things are bubbling in the arcane world of climate modelling these days. Before jumping to the details, we cover some general background on climate models.
The typical climate activist might expect that when climate scientists need to get the answer to some question, they just turn on THE climate model and see what pops out. Of course, things are never that simple. There are, in fact, more than 100 separate climate models used by scientists at more than 20 research organizations around the globe. Each of these climate models offers an estimate of how much future warming will result from a given concentration of greenhouse gases (GHG) in the atmosphere. Scientists rely on this diverse suite of models to check one set of results against another set, and they all coordinate and communicate with one other to ensure that all results are reviewed by peers. From this broad array of model projections, the scientists then agree on a set of “Representative Concentration Pathways” (RCPs) that cover the full range of possible outcomes. For the last ten years, they have used four standard RCP scenarios to prepare the joint reports issued by the IPCC. (These standard scenarios are currently under review and will be modified for the 2021 annual report [AR6]. This explainer from Carbon Brief provides a detailed overview of the current situation as of June 2020.)
The chart below is the best way to see how this works. Each thin line represents the results from a specific model, and the four standard RCP scenarios are shown with labels (top line = worst case and bottom line = target for meeting Paris goal):
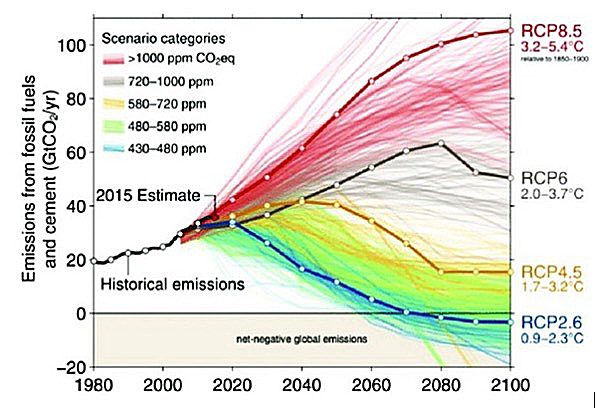
The left axis of the graph shows annual emissions of GHG, and the resulting range of temperature increase in the final years of this century are shown to the right of the graph. The color-coding is based on the ultimate accumulation of GHG in the atmosphere in parts-per-million (ppm).
One issue in the news recently concerns the “worst-case” scenario shown above. When you combine “worst-case” and “scientists” in the same sentence, you might guess that the right-wing climate skeptics will take a crack at twisting the truth – and you would be guessing correctly (…looking at you, Wall Street Journal and Team Trump). This particular story has an interesting timeline that illustrates how a slight disagreement among scientists can be used by the right-wing media to throw some shade on climate science in general. The whole story is too long to cover here, but the end result is captured well by this quote from the end of a piece on the American Thinker website by their resident climate “guru” (drum roll please, here are his name and credentials: “Anthony Watts is former television meteorologist and senior fellow for environment and climate at The Heartland Institute. He operates the most viewed website on climate in the world, WattsUpWithThat.com.”):
“The result is that, given the latest projections of CO2 emissions, future CO2 concentrations will not only be well below the RCP8.5 scenario, but might not even be as high as RCP4.5, with atmospheric CO2 concentrations possibly not even reach a doubling (560 ppm) of estimated pre-Industrial levels (280 ppm) before leveling off. This result is even without future reductions in CO2 emissions, which is a possibility as new energy technologies become available.
The RCP4.5 scenario suggests a range of warming of about 1.7–3.2°C (3–5.8°F), which doesn’t constitute a “climate emergency” and may even be beneficial to humankind. After all, humanity didn’t do well during cold periods in history, and another global ice age would certainly be ruinous.
With this broad uncertainty about what the future climate will be, the bottom line on climate science predictions is well served by the great Yogi Berra, who famously said, “It’s tough to make predictions, especially about the future.”
The standard worst-case scenario used for the last decade is called the RCP 8.5 scenario (don’t ask about the 8.5 part unless you want a PhD course in climate science). This scenario assumes that we continue to accumulate more greenhouse gases (GHG) in the atmosphere through continued fossil fuel burning, to the point where the GHG concentration reaches about 1,250 ppm, and rising, by the year 2100, with a consequent increase in global temperature that would be +4.8⁰C (+8.6⁰F) versus the pre-industrial average. Current concentration levels are now at about 450 ppm (includes about 410 ppm of CO2 plus about 40 ppm for other GHG) and the temperature increase already realized is about 1⁰C.
The RCP 8.5 scenario has often been mischaracterized as the “business-as-usual” scenario, but that is not quite accurate because all it really says is that if we somehow get to 1,250 ppm of GHG, then the warming would be +4.8⁰C by 2100. It never really specified exactly how and where the GHG emissions would come from. However, when the scenario was originally developed ten years ago, the underlying presumption was that a whole bunch of coal would continue to be used, and that is where the RCP 8.5 worst-case scenario is now coming under scrutiny. Today we can be pretty sure that coal use will be much less than expected ten years ago (good news!). Many climate scientists probably do agree that the narrative around what might cause a “worst-case” scenario needs to be updated, but the skeptics are pursuing that as an argument that we should just throw out the RCP 8.5 scenario and its +4.8⁰C result. It is a clever attack because there is an anchor in some truth, but many other issues need to be considered – basically, it’s complicated. Here is a quote from a RedGreenAndBlue article with more detail:
“In sum, RCP 8.5 is in line with the current trajectory of emissions and in line with the pathway promoted by those policy-makers championing the use of fossil fuels such as coal-fired power. However, looking decades ahead, emissions on the current business-as-usual trajectory may ultimately come close to but fall short of, the emissions usually associated with RCP 8.5. Some researchers have identified RCP 7 as a more accurate representation of the emissions in the years further out along the current business-as-usual pathway.
Importantly, the temperature projected by RCP 8.5 may be close to the temperature encountered on the business-as-usual pathway if the carbon feedbacks expected on the business-as-usual path come to pass.
Managing climate change is essentially a risk management exercise, and as such, it is important to know the impacts projected under both high and low emissions scenarios, regardless of the likelihood of each scenario.”
The second issue in the news is more concerning, because it may lead to updated climate models that predict more dire levels of warming than previously expected. Climate scientists regularly recalibrate their models to reflect actual historical data from recent years and to incorporate model improvements based on the constantly developing body of climate science. The detailed assumptions in each model express themselves as a “sensitivity factor” that tells what temperature increase would result from a doubling of the pre-industrial GHG concentration level. For almost 40 years, the various climate models have basically agreed that this key sensitivity metric is around 3⁰C, and the modelling community has expressed an “acceptable range” of 1.5⁰C to 4.5⁰C. But now many of the models are “running hot” with sensitivity metric results much higher than 3⁰C, including several higher than the previously used 4.5⁰C maximum for the “acceptable range”. In the current updating process (referred to as CMIP6) almost 20% of the models have seen jumps of 30% or more in their sensitivity metric. The scientists are actively trying to sort out the reasons, but one topic under close review is some new understanding on how cloud formation dynamics affect the process of global warming. Too early to panic, but keep your eye on this topic in coming months as the science community does their thing. If the end result is consensus around a higher sensitivity factor, then all of the temperature outcomes in the graph above would jump to higher levels.
For the best current thinking on both of these issues, eminent climate scientist Michael Mann has this relatively short piece which is worth reading.


