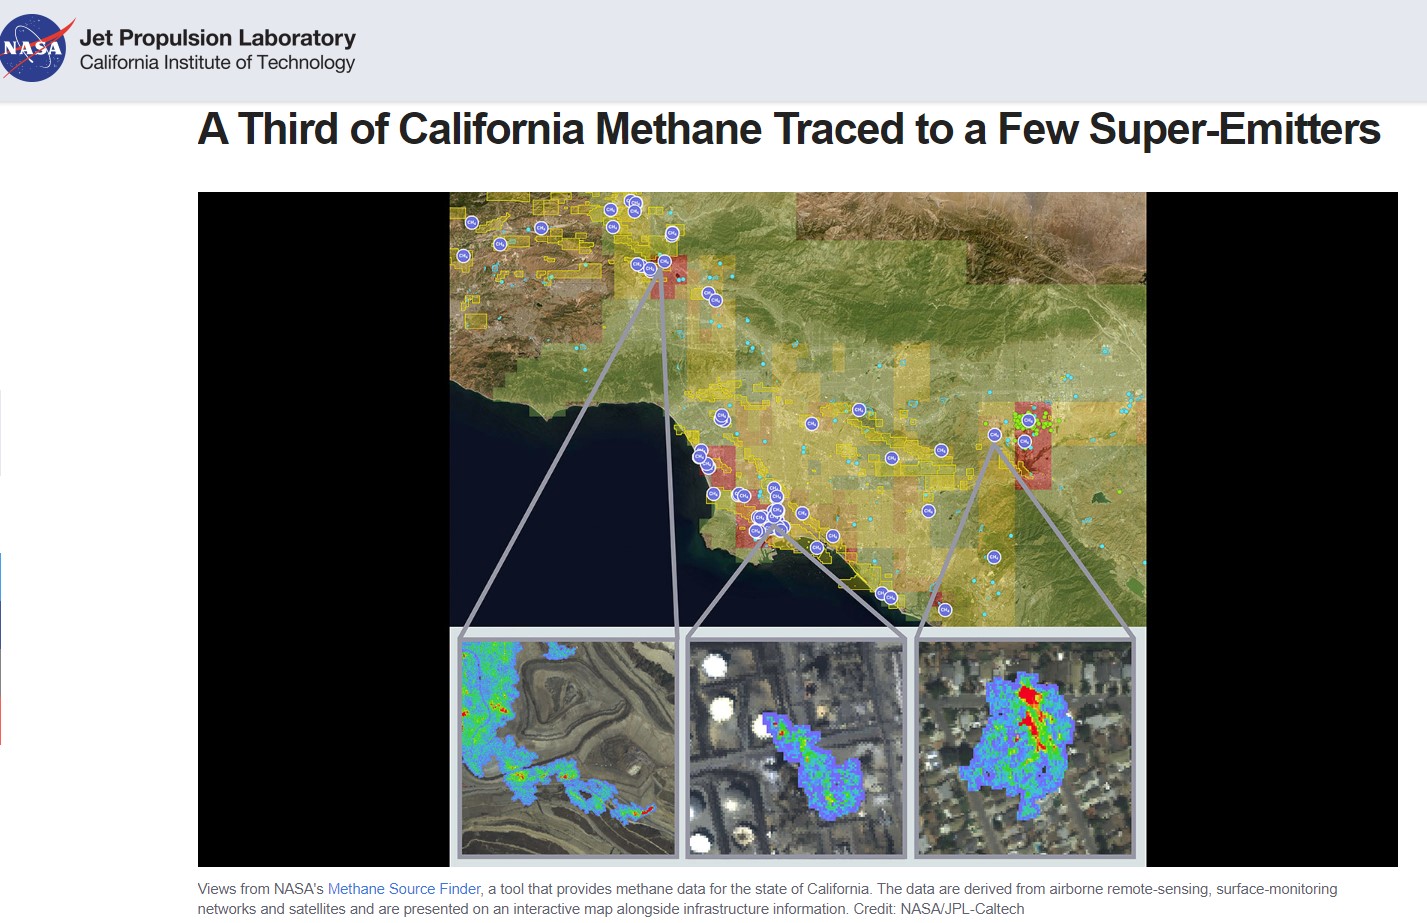
Methane plumes in Ventura County around CNG storage tanks, oil and gas infrastructure, and landfills – From NASA-JPL Laboratory
The Ventura County General Plan should acknowledge the science from aerial surveys of methane plumes that allow precise attribution of past or potential sources of methane emissions in the county. We see high levels of methane being released throughout the oil patch, around solid waste and wastewater facilities, and along SoCalGas pipelines and delivery locations. They biggest ones need to be stopped now. The County should create a program to use best practices for top-down and bottom-up measurement of methane emissions and a reasonable process to synthesize the data in order to find and easily mitigate at least a third of such sources. A Methane MRV (Monitoring, Reporting and Verification) Program would enable the county to first acknowledge the verifiable existence of large, sometimes sporadic, but sometimes very large methane leaks and find ways to fix them. There are many cases of “low-hanging fruit” described in the United Nations Best Practice Guidance for Effective Methane Management in the Oil and Gas Sector that should be fixed now.
The recently released Environmental Impact Report (EIR) for the Ventura County General Plan states that the County will not count the leaked methane documented from the NASA-JPL aerial surveys “because there is lack of consensus among scientific experts on a technical definition for “super emitter” sources. ” It then provides citations that appear to support this reason. See the full quote below from the EIR Master Responses page 2-11.
This decision to not count super emitter methane plumes from fixed sources or to launch a process to mitigate them results in under-counting them in the Greenhouse Gas Inventory in the EIR. Hence, the County has reduced that part of the inventory based on only using the models from CA Air Resources Board. This hides these GHGs from everyone and reduces the county’s responsibility to achieve net-zero emissions. It omits needed policy and a program for monitoring and cleaning up these methane leaks.
The reason given is semantic and not substantive. It misleads the reader into assuming that nothing can be done about documented methane plumes so we should ignore this significant negative environmental impact. It dismisses the ample description in the United Nations Best Practices reference cited in the EIR that there is a way to compare top-down and bottom-up and various models in an uncertainty analysis because there are usually multiple values for a parameter. Because scientists are struggling with the best ways to synthesize the data does not mean that we can ignore a substantial amount of climate forcing methane gas.
- The empirical evidence of NASA/JPL data show that there are substantial methane emissions in VC that are not included in the County’s emission inventory, nor are they accounted for in the assumed source-specific “emission factors” developed by CA Air Resources Board and used by the VC Air Pollution Control District in the permitting process.
- The County in the EIR actually chose instead of citing the science and technology in their reference to revise and lower their emission inventory of methane for stationary sources and solid waste, based on a “discovered error”, while ignoring the substantial evidence of underestimated methane emissions that have been proven. Whether there is or is not agreement on the definition of super emitters which is given as the reason for this omission is totally irrelevant. The fact is that there are significant emissions of methane that have not been previously known or acknowledged to exist in the county.
- The County still refuses to do a sensitivity analysis on the GWP value for methane despite guidance provided on why and how that could be done. The GWP value used by the County is for apples-to-apples comparison across jurisdictions and over time to show relative differences and changes in methane levels. Neither CARB, EPA nor the IPCC suggest that the low inventory value for GWP assigned to methane should be used for policy-setting. The appropriate value should be set closer to 75-80 based on the relative impact of methane within the atmospheric life-span of this gas and there is a rationale for rounding the value to 100 for the GWP of methane).
- The UNECE Best Practice Guidance for Effective Methane Management in the Oil and Gas Sector, the reference used in the EIR to justify not counting methane from super emitters, defines what it is and states that it is important and increasingly feasible to mitigate perhaps up to a third of the sites in a region by a mix of measurements to find many of the biggest leaks and fix them. This is especially important for landfills where the amount of methane is generally under reported.
- On page xiii Emission detection and measurement must complement calculation-based approaches that quantify emissions by multiplying activity data by relevant emission factors. Estimates will be more reliable if they reflect field and country specific circumstances, so empirical studies of emissions and emission intensities are a key to improved quantification….The technology for both top-down and bottom-up approaches is improving…. Best practices… depend on the objectives and the manner of reporting.
- On page 10 Given the importance of ‘super emitters’, MRV [Monitoring, Reporting and Verification] should be designed to account for this dominant emission sources.
- On page 34, “A small number of emissions points typically represent most emissions (see Box 4-2). Giving priority to these emission points provides substantial emission reductions and is cost effective.”
- On page 36 “Systematic and frequent surveys allow for identifying and addressing these sources of emissions in a timely manner.Given the magnitude of the super emitters, less-sensitive and cheaper detection technologies can be used.”
- CA Air Resource Board modeling data may be a useful way of estimating methane from fixed sources for a GHG inventory, but we also have NASA/JPL real data on their website showing the locations of large emissions. They offer this data from aerial surveys funded by CARB because of the intense Global Warming Potential. The number of methane plumes and measured fugitive methane is high in Ventura County as can easily be seen on the NASA/JPL Methane Map for California. https://methane.jpl.nasa.gov/
- NASA/JPL scientists offer the mapping and data because they say that “methane is…being increasingly prioritized by California and other governments for near-term climate action given its relatively short atmospheric lifetime and the potential for rapid, focused mitigation that can complement economy-wide efforts to reduce carbon dioxide emissions. Methane is also a precursor for tropospheric ozone and is strongly linked with co-emitted reactive trace gases targeted by air quality and public health policies in California. Finally, methane vented to the atmosphere from leaks in natural gas infrastructure – if not promptly detected and repaired – can result in costly product loss and (in sufficiently large quantities) a combustion hazard. All of the above factors motivate the need for sharing methane data across a broad range of scales.”
- The NASA Methane Map is the product of peer-reviewed science as reported in these articles:
Methane point-source data and Vista-CA spatial layers, Duren, R., A.Thorpe, K.T. Foster, T. Rafiq, F. M. Hopkins, V. Yadav, B.Bue, D.R. Thompson, S. Conley, N. Colombi, C. Frankenberg, I.McCubbin, M.Eastwood, M.Falk, J. Herner, B. E. Croes, R. Green, C. Miller, California’s Methane Super-emitters, Nature (2019). https://doi.org/10.1038/s41586-019-1720-3
Los Angeles methane flux inversion maps, Yadav, V., R. Duren, K.Mueller, K.R. Verhulst , T. Nehrkorn, J. Kim, R.F. Weiss, R. Keeling, S.Sander, M. L. Fischer, S.Newman, M. Falk, T. Kuwayama, F. Hopkins, T.Rafiq, J. Whetstone, C. Miller, Spatio-temporally resolved methane fluxes from the Los Angeles Megacity, J. Geophy. Res. Atmospheres. (2019). https://doi.org/10.1029/2018JD030062
EPA (US Environmental Protection Agency) gridded methane-inventory, Joannes D. Maasakkers, Daniel J. Jacob, Melissa P. Sulprizio, Alexander J. Turner, Melissa Weitz, Tom Wirth, Cate Hight, Mark DeFigueiredo, Mausami Desai, Rachel Schmeltz, Leif Hockstad, Anthony A. Bloom, Kevin W. Bowman, Seongeun Jeong, and Marc L. Fischer, Gridded National Inventory of U.S. Methane Emissions, Environ. Sci. Technol. 2016,50,23,13123-3133. https://doi.org/10.1021/acs.est.6b02878TY
12. The exact locations of the super-emitters are easy to see on the Methane Map website.
13. Less than 0.2% of infrastructure elements in the state (700 out of 272,000 facilities and components) are responsible for 34–46% of total methane emissions in California. A comparable survey of priority sites can be done easily from the NASA map and public database.
14. NASA/JPL scientists recommend looking at those super-emitters as significant “low hanging fruit for mitigation”.
15. Some of the emissions are long-standing leaks that can be quickly repaired when the owner is informed. Leaks have historically been monitored by VCAPCD at least annually. If a source develops a history of violations they are inspected more frequently. NOVs are issued, and fines assessed when there are violations of the permit conditions.
16. A program of less expensive remote sensing in priority regions can make much more frequent monitoring possible and as NASA scientists say “improve methane budgets and accelerate mitigation action, particularly when combined with complementary measurement systems.”
17. The baseline value of a ton of methane (CH4) is $4700, which should be the basis for fines for methane emissions. This revenue should pay for a program of frequent remote sensing to alert those responsible and then assess fines.
18. There must be 24 hour corrective action in response to NOVs.
19. If the VCAPCD does not believe it has the authority to establish this policy and program it is incumbent on the county to work with scientists to establish a program rather than defer to the CARB or the State Legislature that have no immediate plan to establish simple policies to curb methane emissions.
20. The calculation of $4,700 per ton is the recognized best science. See “The social cost of atmospheric release”, Drew T. Shindell, Climatic Change (2015) 130:313–326, DOI 10.1007/s10584-015-1343-0, page 319, Table 2. The fee or fine for super-emitter sites associated with oil and gas production should start immediately at $4,700 per ton. Measurements of priority sites should be at least weekly and may be every 10 minutes. If the emitting entity believes the estimate of tons of methane is overestimated, it must provide evidence.
21. State law does not require monitoring of agricultural methane, but the State should not prevent a county from using the availability of data like the NASA/JPL data and follow best practices to establish MRV (monitoring, reporting, verification) and mitigation and fines for agricultural methane comparable to a tracking and fines program for oil and gas production emitter sites.
22. We only have 10 years to completely figure this out and stop emitting methane.
FROM THE VC2040 EIR MASTER RESPONSES TO THE DRAFT ENVIRONMENTAL IMPACT REPORT:
Fugitive Methane Emissions
Several commenters also noted that a group of GHG emitting sources collectively known as “super emitters” were not included in the analysis. This category of fugitive methane emissions was not included because there is lack of consensus among scientific experts on a technical definition for “super emitter” sources. A 2019 publication from the United Nations on best practices for effective methane management acknowledges .”..there is no single quantitative definition of a super-emitter, some consider them to be the top 5 percent of emissions sources while others consider them to be sources defined vis-a-vis an average emission factor (e.g. 5 times the average emission factor) or with the top 15 percent emission factors” (UNECE 2019). Fugitive emissions from stationary sources, including oil and gas extraction, were modeled following the California Air Resource Board’s recommended methodology. Refer to final EIRAttachment 2 [p5-6] for further explanation of the methodology used to quantify fugitive methane emissions from stationary sources. Also refer to Master Response MR-4 pertaining to oil and gas policies for additional information.
Summary of Revisions to the 2015 Greenhouse Gas Inventory and 2040 Forecast Appendix D to the draft EIR has been revised in response to comments received on the draft EIR that expressed concern over the methodology used to quantify and forecast stationary source emissions and solid waste emissions. After reviewing the calculations behind the stationary source and solid waste emissions, calculation errors were discovered and have been corrected, and new data have been used to revise the GHG inventory and forecasts. These changes resulted in an overall reduction in total GHG emissions estimates compared to the total GHG emissions calculated in the draft EIR. Refer to Attachment 2 to this final EIR for a more detailed explanation of these changes.
The revised inventory would reduce the amount of emissions needed to meet the County’s GHG targets, which would result in minor modifications to the draft EIR analysis (as provided in Chapter 3, “Revisions to the Draft EIR”). These revisions clarify and support the analysis and conclusions in the draft EIR, and would not result in new or more severe significant impacts. The GHG reduction policies and programs of the 2040 General Plan identified in the draft EIR analysis would not be affected and forecasted GHG emissions would still result in significant and unavoidable impacts. ~~~~~~~~~~~~~~~~~~~~~~~~~~~~~~~~~
This quote from the Master Reponses to comments made on the Draft EIR in 2019. This subject can be found on page 2-11 here:
https://ventura.granicus.com/MetaViewer.php?view_id=83&event_id=1379&meta_id=753560