 350 parts per million is what many scientists, climate experts, and progressive national governments have long been saying is the safe upper limit for CO2 in our atmosphere.
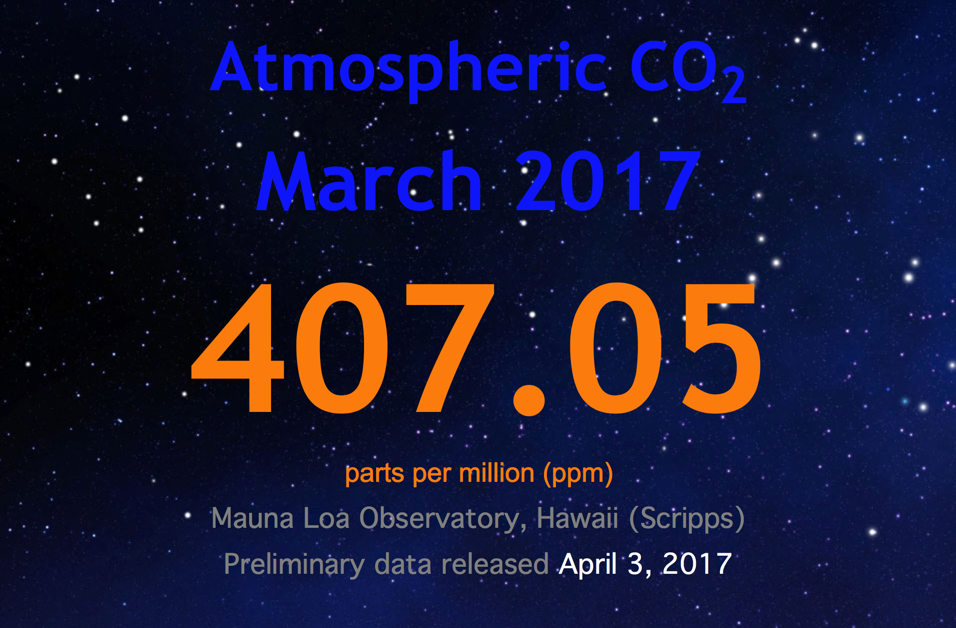
Accelerating arctic warming and other early climate impacts have led scientists to conclude that we are already above the safe zone at our current 407ppm, and that unless we are able to rapidly return to below 350 ppm this century, we risk reaching tipping points and irreversible impacts such as the melting of the Greenland ice sheet and major methane releases from increased permafrost melt.
“Climate change: How do we know?”
From the NASA Global Climate Change – Evidence page
The current warming trend is of particular significance because most of it is very likely human-induced and proceeding at a rate that is unprecedented in the past 1,300 years.1
Earth-orbiting satellites and other technological advances have enabled scientists to see the big picture, collecting many different types of information about our planet and its climate on a global scale. This body of data, collected over many years, reveals the signals of a changing climate.
The heat-trapping nature of carbon dioxide and other gases was demonstrated in the mid-19th century.2 Their ability to affect the transfer of infrared energy through the atmosphere is the scientific basis of many instruments flown by NASA. There is no question that increased levels of greenhouse gases must cause the Earth to warm in response.
Ice cores drawn from Greenland, Antarctica, and tropical mountain glaciers show that the Earth’s climate responds to changes in greenhouse gas levels. Ancient evidence can also be found in tree rings, ocean sediments, coral reefs, and layers of sedimentary rocks. This ancient, or paleoclimate, evidence reveals that current warming is occurring roughly ten times faster than the average rate of ice-age-recovery warming.3
The evidence for rapid climate change is compelling:
Sea level rise
-
Global sea level rose about 8 inches in the last century. The rate in the last two decades, however, is nearly double that of the last century.4Image: Republic of Maldives: Vulnerable to sea level rise
Global temperature rise
-
All three major global surface temperature reconstructions show that Earth has warmed since 1880.5 Most of the warming occurred in the past 35 years, with 15 of the 16 warmest years on record occurring since 2001. The year 2015 was the first time the global average temperatures were 1 degree Celsius or more above the 1880-1899 average.6 Even though the 2000s witnessed a solar output decline resulting in an unusually deep solar minimum in 2007-2009, surface temperatures continue to increase.7
Warming oceans
-
The oceans have absorbed much of this increased heat, with the top 700 meters (about 2,300 feet) of ocean showing warming of 0.302 degrees Fahrenheit since 1969.8
Shrinking ice sheets
-
The Greenland and Antarctic ice sheets have decreased in mass. Data from NASA’s Gravity Recovery and Climate Experiment show Greenland lost 150 to 250 cubic kilometers (36 to 60 cubic miles) of ice per year between 2002 and 2006, while Antarctica lost about 152 cubic kilometers (36 cubic miles) of ice between 2002 and 2005.Image: Flowing meltwater from the Greenland ice sheet
Declining Arctic sea ice
-
Both the extent and thickness of Arctic sea ice has declined rapidly over the last several decades.9Image: Visualization of the 2007 Arctic sea ice minimum
Glacial retreat
-
Glaciers are retreating almost everywhere around the world — including in the Alps, Himalayas, Andes, Rockies, Alaska and Africa.10 Image: The disappearing snowcap of Mount Kilimanjaro, from space.
Extreme events
-
The number of record high temperature events in the United States has been increasing, while the number of record low temperature events has been decreasing, since 1950. The U.S. has also witnessed increasing numbers of intense rainfall events.11
Ocean acidification
-
Since the beginning of the Industrial Revolution, the acidity of surface ocean waters has increased by about 30 percent.12,13 This increase is the result of humans emitting more carbon dioxide into the atmosphere and hence more being absorbed into the oceans. The amount of carbon dioxide absorbed by the upper layer of the oceans is increasing by about 2 billion tons per year.14,15
Decreased snow cover
-
Satellite observations reveal that the amount of spring snow cover in the Northern Hemisphere has decreased over the past five decades and that the snow is melting earlier.16
References
-
IPCC Fourth Assessment Report, Summary for Policymakers, p. 5
B.D. Santer et.al., “A search for human influences on the thermal structure of the atmosphere,” Nature vol 382, 4 July 1996, 39-46
Gabriele C. Hegerl, “Detecting Greenhouse-Gas-Induced Climate Change with an Optimal Fingerprint Method,” Journal of Climate, v. 9, October 1996, 2281-2306
V. Ramaswamy et.al., “Anthropogenic and Natural Influences in the Evolution of Lower Stratospheric Cooling,” Science 311 (24 February 2006), 1138-1141
B.D. Santer et.al., “Contributions of Anthropogenic and Natural Forcing to Recent Tropopause Height Changes,” Science vol. 301 (25 July 2003), 479-483.
-
In the 1860s, physicist John Tyndall recognized the Earth’s natural greenhouse effect and suggested that slight changes in the atmospheric composition could bring about climatic variations. In 1896, a seminal paper by Swedish scientist Svante Arrhenius first predicted that changes in the levels of carbon dioxide in the atmosphere could substantially alter the surface temperature through the greenhouse effect.
-
National Research Council (NRC), 2006. Surface Temperature Reconstructions For the Last 2,000 Years. National Academy Press, Washington, D.C.
http://earthobservatory.nasa.gov/Features/GlobalWarming/page3.php
-
https://www.ipcc.ch/pdf/assessment-report/ar5/syr/AR5_SYR_FINAL_SPM.pdf
Church, J. A. and N.J. White (2006), A 20th century acceleration in global sea level rise, Geophysical Research Letters, 33, L01602, doi:10.1029/2005GL024826.
The global sea level estimate described in this work can be downloaded from the CSIRO website.
-
http://www.giss.nasa.gov/research/news/20160120/
T.C. Peterson et.al., “State of the Climate in 2008,” Special Supplement to the Bulletin of the American Meteorological Society, v. 90, no. 8, August 2009, pp. S17-S18. -
I. Allison et.al., The Copenhagen Diagnosis: Updating the World on the Latest Climate Science, UNSW Climate Change Research Center, Sydney, Australia, 2009, p. 11
http://www.giss.nasa.gov/research/news/20100121/
http://science.nasa.gov/headlines/y2009/ 01apr_deepsolarminimum.htm
-
Levitus, et al, “Global ocean heat content 1955–2008 in light of recently revealed instrumentation problems,” Geophys. Res. Lett. 36, L07608 (2009).
-
L. Polyak, et.al., “History of Sea Ice in the Arctic,” in Past Climate Variability and Change in the Arctic and at High Latitudes, U.S. Geological Survey, Climate Change Science Program Synthesis and Assessment Product 1.2, January 2009, chapter 7
R. Kwok and D. A. Rothrock, “Decline in Arctic sea ice thickness from submarine and ICESAT records: 1958-2008,” Geophysical Research Letters, v. 36, paper no. L15501, 2009
-
“Attribution of Extreme Weather Events in the Context of Climate Change,” National Academies Press, 2016
https://www.nap.edu/read/21852/chapter/1Kunkel, K. et al, “Probable maximum precipitation and climate change,” Geophysical Research Letters, (12 April 2013) DOI: 10.1002/grl.50334
Kunkel, K. et al, “Monitoring and Understanding Trends in Extreme Storms: State of the Knowledge,” Bulletin of the American Meteorological Society, 2012.
-
C. L. Sabine et.al., “The Oceanic Sink for Anthropogenic CO2,” Science vol. 305 (16 July 2004), 367-371
-
National Snow and Ice Data Center
C. Derksen and R. Brown, “Spring snow cover extent reductions in the 2008-2012 period exceeding climate model projections,” GRL, 39:L19504
http://nsidc.org/cryosphere/sotc/snow_extent.html
Rutgers University Global Snow Lab, Data History Accessed August 29, 2011.